
About This Document
There is an Enhanced Reports tab available to Prendio users with the AP Management role. This document provides an overview of the Enhanced Reports feature and links to specific reporting tasks available.
Capabilities of Enhanced Reports
- Quick analysis of Operational Performance Metrics
- Default reports available for AP Order Analysis
- Additional visualization options, including bar, line, and pie charts
- Ability to modify default reports or create a report from scratch
- Scheduling reports to be run periodically with notification
- Exporting report results with multiple file format options
Accessing Enhanced Reports
This section can be accessed in Prendio under [AP Management > Enhanced Reports].
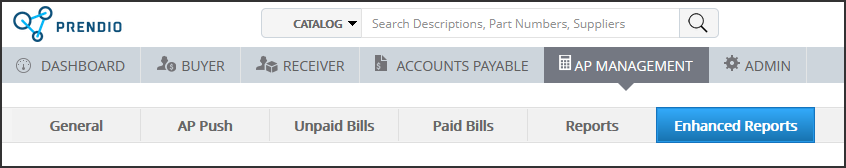
Note: The original Reports tab remains available to users with the AP Management role.
Operational Performance Metrics
The home page under Enhanced Reports is the Operational Performance Metrics dashboard. This page provides information on the number of purchase orders, receipts, and vouchers processed over a period of time.
You can select the period of time used for this information using the Last Week, Last Month, or Last 3 Months buttons at the top of the dashboard.
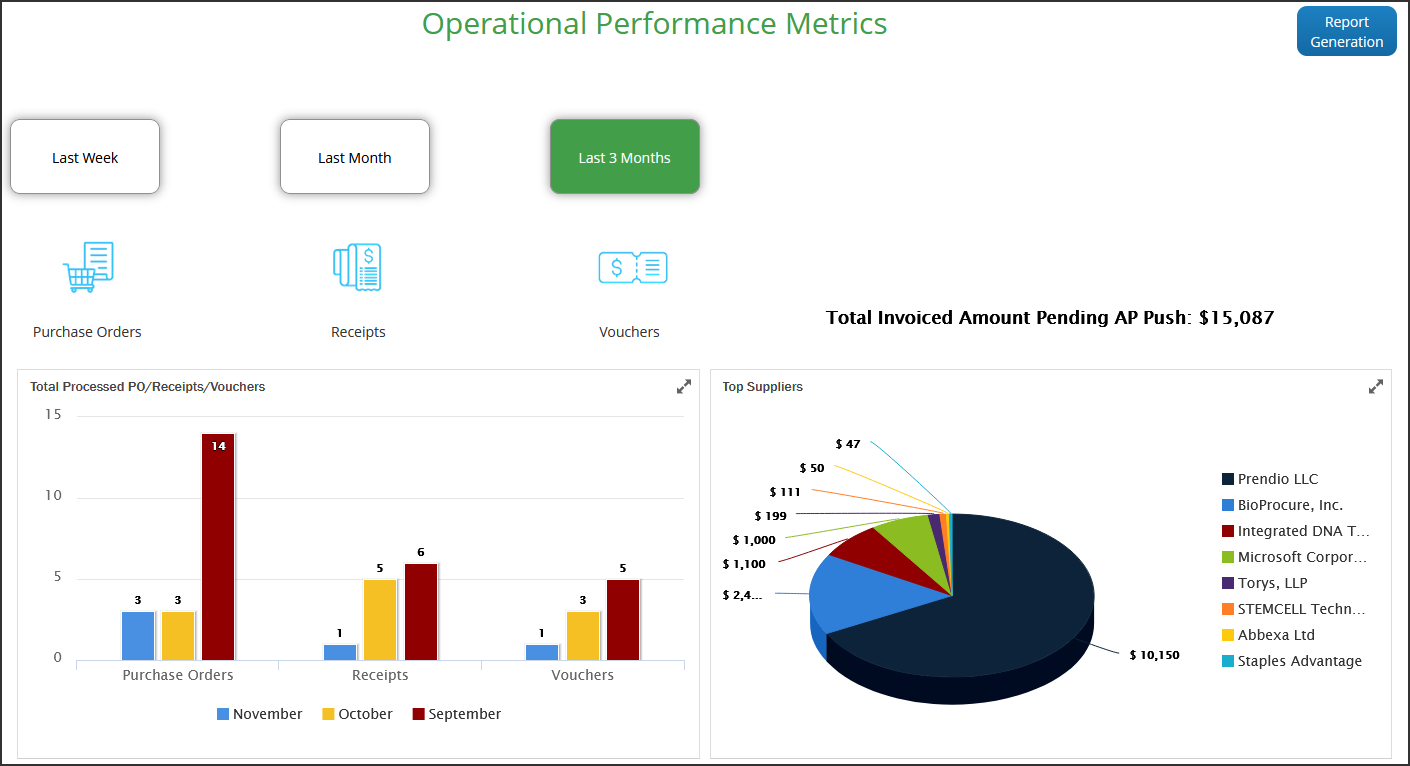
There is also Total Invoiced Amount Pending AP Push chart. This chart evaluates the dollar amount of the vouchers presently in AP Push and shows the top 10 suppliers associated based on their total dollar amount. This chart displays information as point-in-time and is not impacted by the three buttons.
Viewing Reports on the Report Generation Page
Enhanced Reports offers the ability to load default reports, customize your own reports, and schedule reports. To access these features, click the Report Generation button from the Operational Performance Metrics dashboard.
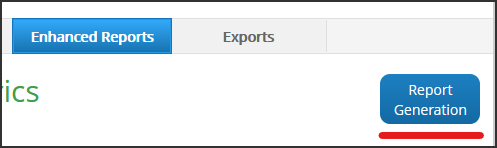
This will take you to the Report Generation page.
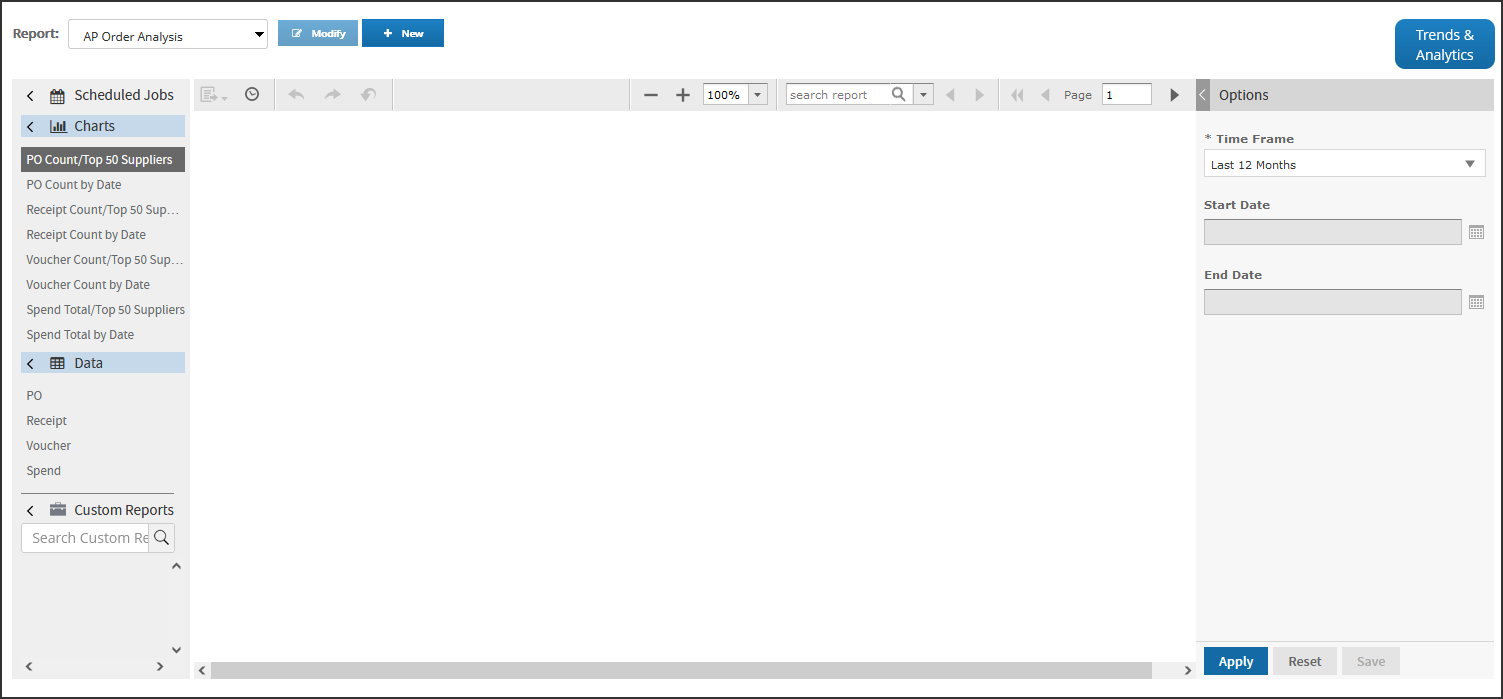
Running Reports and Charts
This report type is presently available for use in Enhanced Reports:
- AP Order Analysis
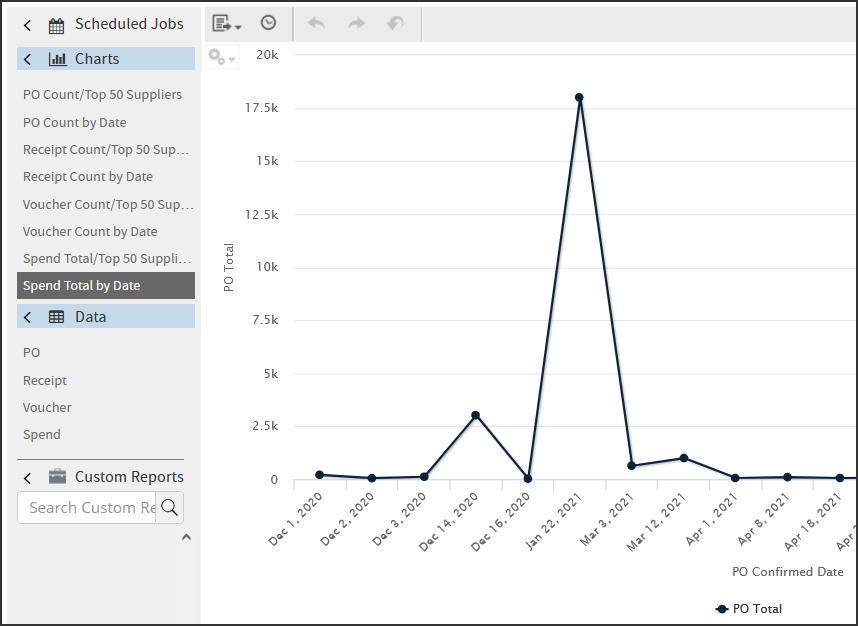
You can run default reports and your Custom Reports from the Report Generation page. The Charts and Data sections have default reports that pull information on Purchase Orders, Receipts, Vouchers, and Spending. These default reports are preconfigured with one of two visual types:
1. Line Charts for reports under Charts:
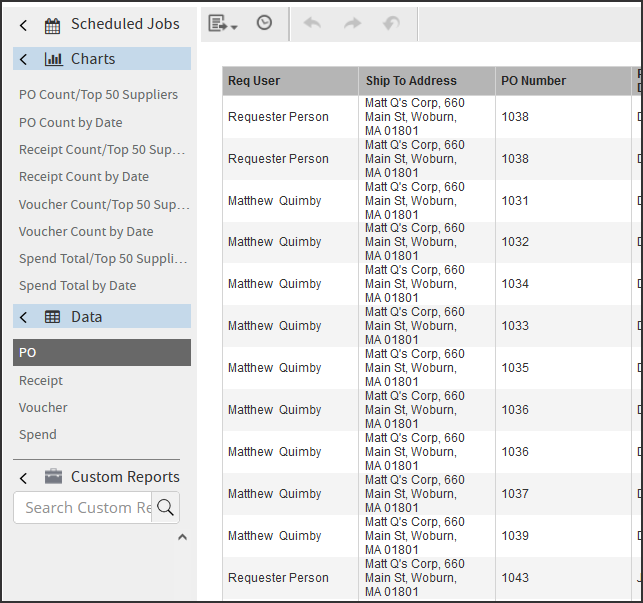
2. Tables for reports under Data:
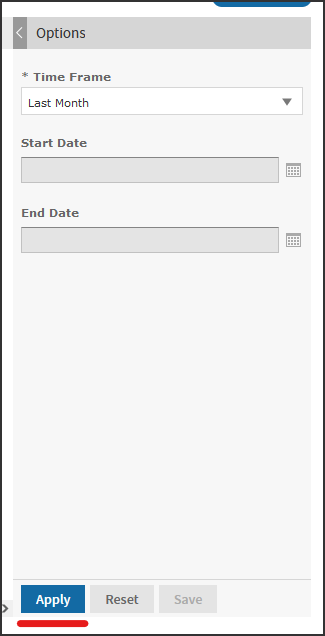
After selecting a report under Charts, Data, or Custom Reports, go to the Options section to the right of the report area.
Time Frame is required for a report to run. Depending on which report is running, the Time Frame involves the PO Confirmation Date or the date that a Receipt or Voucher is created. There is a "Custom Date Range" selection available if you want to define a unique Start Date and End Date.
You can complete the remaining options as needed and click the Apply button.
After clicking Apply, the report loads onto the Report Generation page.
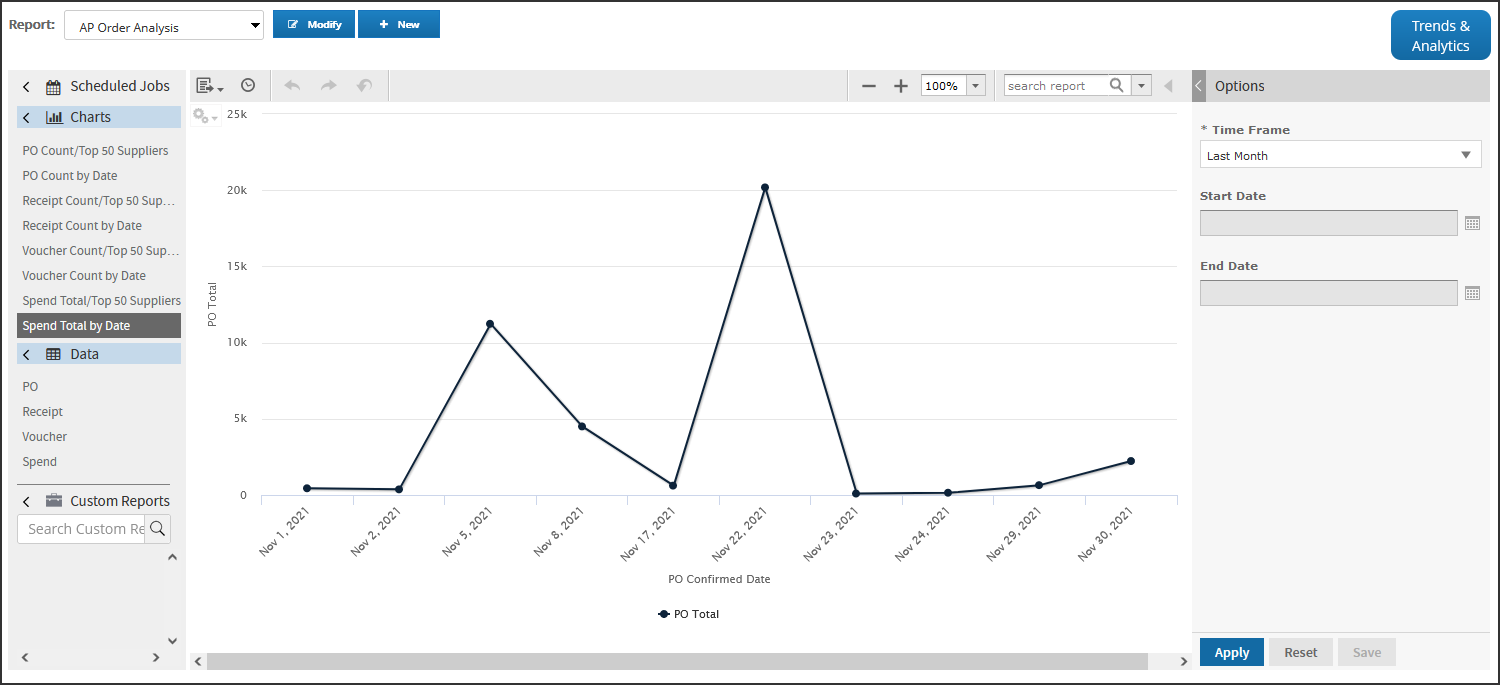
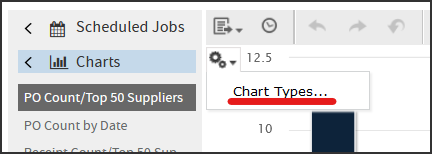
After running a Charts report, you can click the Gears icon and select Chart Types to choose different visual styles like bar or pie charts.
Modifying Default Report and Saving as a Custom Report
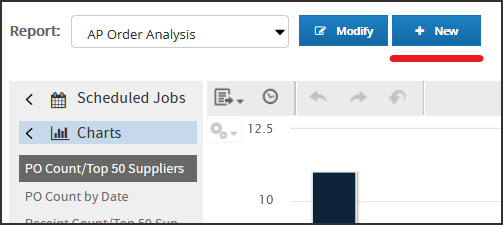
The Enhanced Report feature gives you the capability to create a report or modify an existing report. To create a new report, click the + New button next to the report list.
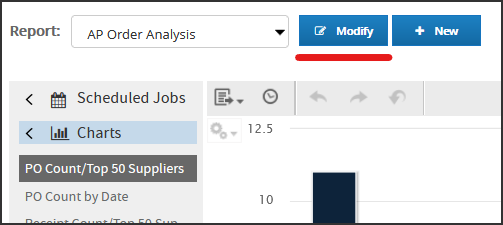
To modify an existing report, run that report first and then click the Modify button next to the report list.
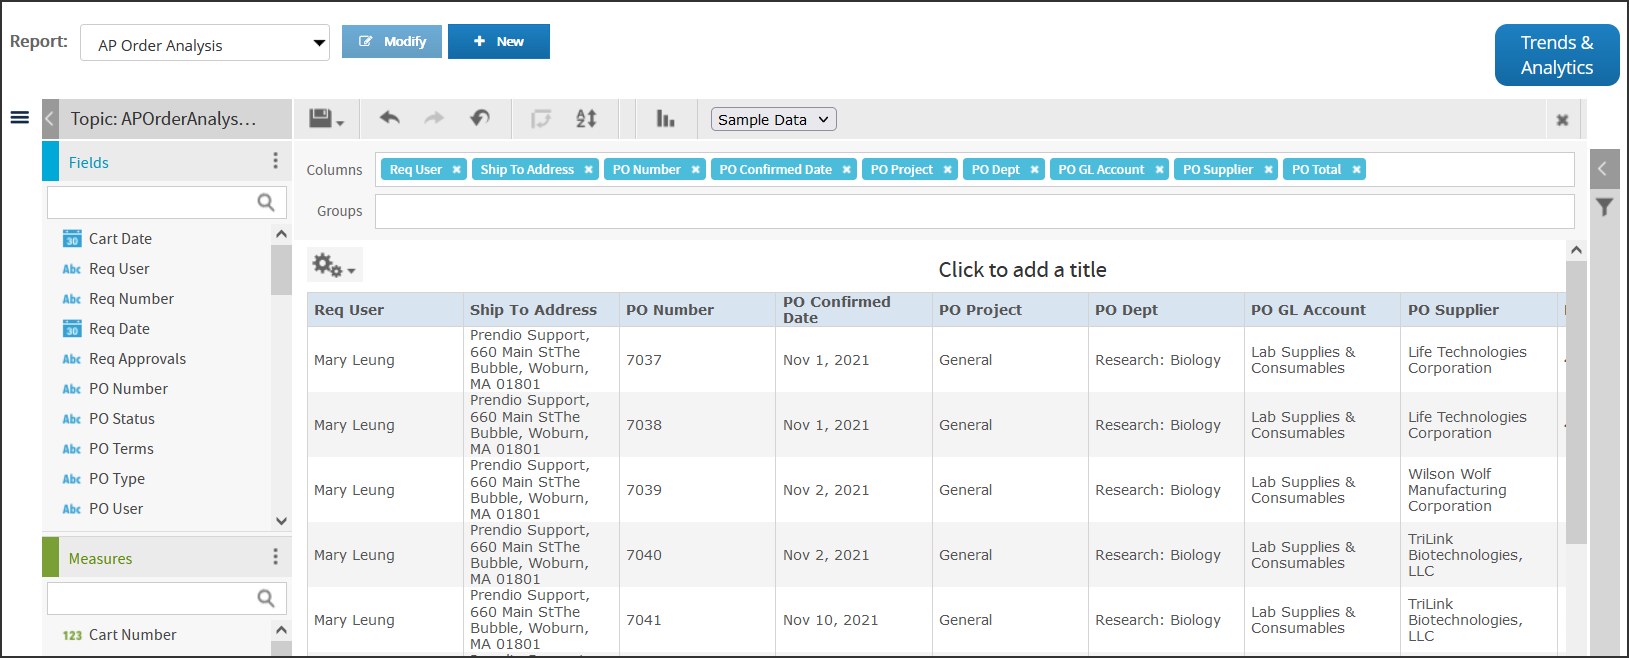
Clicking either button will open a Report Customization page. Here you customize different elements of the report, such as columns, sorting, filters, and the grouping of data. If you are modifying an existing report, there are pre-existing values you can see and change.
Any customized report you save can be accessed back in the Report Generation page. They are listed in the Custom Reports section, below Default Reports.
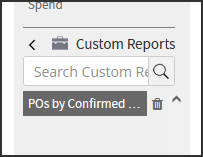
For further details about how to customize reports, see the Creating Custom Reports with Enhanced Reports help doc.
Scheduling a Report
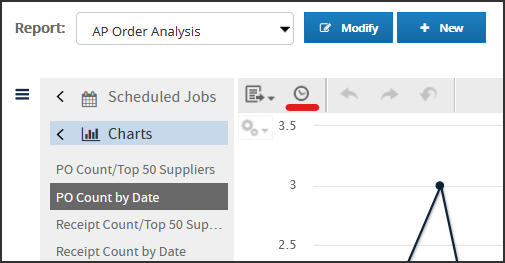
After running a report, you can setup a scheduled job that will run the report at required frequencies. To do this, click the Schedule button.
A new New Schedule page appears with tabs that walk you through the options for when to run the job and how to notify you when it is complete.

You can review, edit, and disable reports you have scheduled by clicking the Scheduled Jobs link on the Report Generation page.
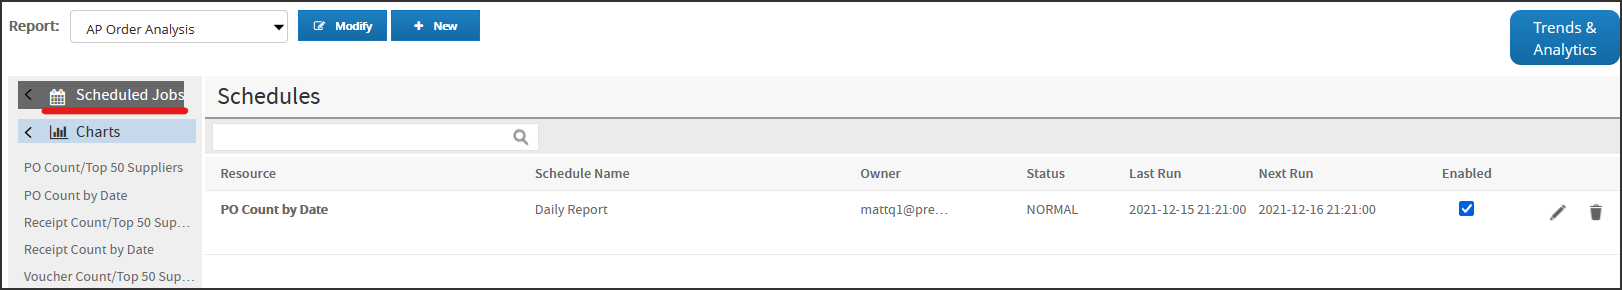
For further details about scheduling reports, see the Creating Schedule Jobs with Enhanced Reports help doc.
Exporting a Report
After you run a report, you have the ability to export it for distribution or external reporting processes. The export menu is between the report selection menu and Schedule button.
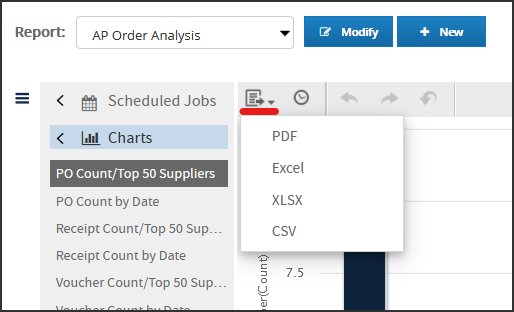
You can export in these file formats:
- PDF
- .xls for Microsoft Excel
- .xlsx for Microsoft Excel
- CSV